T-Line Strategy
The T-Line strategy. As you can see from the price action chart above, the T-Line strategy is very simple and easy to follow, compared with other strategies. Unlike some complex strategies, there are only 3 simple steps to trading the T-Line strategy.
First of all, this is price action trading based on candlestick analysis. So, the first step is to read the candle and determine market sentiment. When we see the Doji candle (highligted in blue), we know there is a high probability that market sentiment is changing.
The next step is to wait for confirmation. In the example above, we can see that a bullish candle has closed above the yellow T-Line (8 EMA) immediately after the doji candle. We now have confirmation that sentiment is bullish and can confidently enter a high probability long trade.
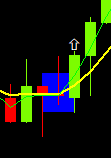
The final step is to check the stochastic. In this example, the stochastic shows that we are already overbought. But….we don’t trade based on the stochastic, only use it for final confirmation if possible. If we avoided this trade because of the stochastic being overbought, we would have missed out on 260 pips!
The T-Line strategy is simple and easy to spot. You will find that it will give you the indication of an upcoming high probability trade. It can be used on all time frames, but I prefer the M5 chart and will place my stop loss about 20 pips away from the entry. Use your own money management techniques if you decide to use this strategy. And of course, practice with a demo account before going live. Leave any comments or questions below and please share this page with your friends.
For more detailed information on trading the T-Line strategy, watch this video by the T-Line master Stephen Bigalow. Watch the Video Below